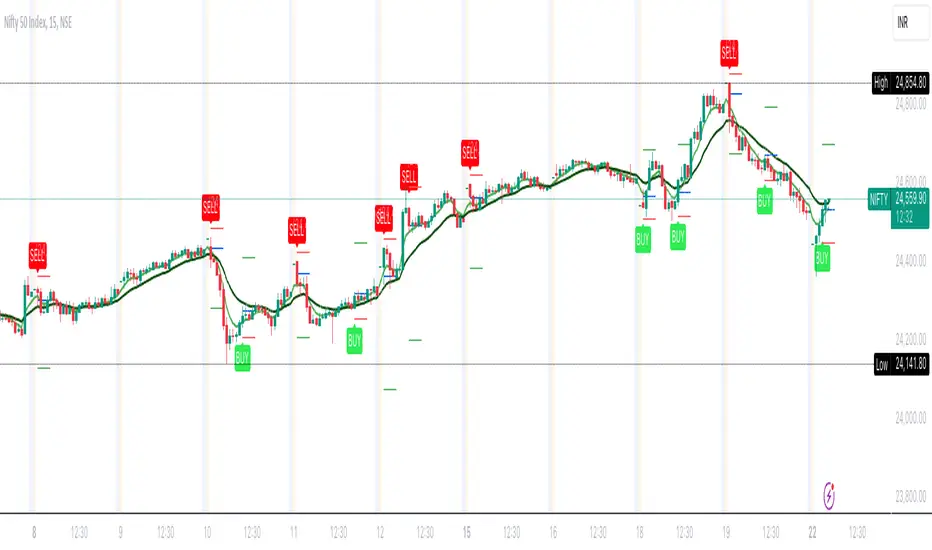
Swing Trades Validator - The One TraderThis swing trading strategy validator is built on the original strategy taught in my bootcamp for swing traders.
The strategy is simple and follows a trend trading pattern on prices reacting to Exponential Moving Averages over a multiple time-frame analysis.
The details of the strategy are as follows:
- Holding Period : Upto a couple of months
- Time-frames to be analysed : Month - Week - Day
- Trade Execution : Daily Time-frame
Analysis Details:
Step 1 : On the Monthly time-frame, the candle needs to be bullish with the latest close being higher than the opening price of the month.
Step 2 : The price needs to be above the 8ema on the Monthly time-frame.
Step 3 : The 8ema must be above the 20ema on the Monthly time-frame.
The above steps indicate a bullish strength in the instrument on the Monthly time-frame.
Step 4 : On the Weekly time-frame, the candle needs to be bullish with the latest close being higher than the opening price of the week.
Step 5 : The price needs to be above the 8ema on the Weekly time-frame.
Step 6 : The 8ema must be above the 20ema on the Weekly time-frame.
The above steps indicate a bullish strength in the instrument on the Weekly time-frame.
Step 7 : On the Daily time-frame, the candle needs to be bullish with the latest close being higher than the opening price of the day.
Step 8 : The price needs to be above the 8ema on the Daily time-frame.
Step 9 : The 8ema must be above the 20ema on the Daily time-frame.
The above steps indicate a bullish strength in the instrument on the Daily time-frame.
Step 10 : While the 8ema is above the 20ema on the Daily time-frame, the price must be allowed to rise before a pullback is seen towards the moving averages, indicating a bearish move trying to change the trend.
Step 11 : These pullback candles need to form a pattern called the Ring Low with the second pullback candle having a lower high and lower low and the low of the last pullback candle being lesser than or equal to the fat ema on the Daily time-frame.
Step 12 : If the stock is still bullish and the trend is displaying a strength in the underlying bullish direction, then there will be a resumption candle that will have a closing price higher than the previous day's high price.
This trend continuation signal is a confirmation that the instrument will continue in the underlying trend direction and we will be able to enter if this condition is satisfied.
The profit and loss percentages are set at a default 10% as this can be a minimum risk : reward for swing trades on average, but the inputs have been made available to the users in order to adjust the risk : reward to find the most optimum breathing room for each individual stock or instrument. This will give the user a highly custom overview of the strategy on individual instruments based on their volatility and price movements.
The strategy tester will auto back-test this strategy historically and find all the trades that were taken based on this strategy and populate a performance summary.
The most important data in V1.0 of this script are as follows:
1. No. of Trades Taken : We want to see many trades being taken on this strategy in that particular instrument. This shows us a healthy report on the number of winning vs. losing trades.
2. Percentage Profitable : We want to see that this strategy has worked out in the past and is giving us a high probability of return. This in no way an indication that the strategy will definitely work out in the future as well, but gives us an idea of whether or not we should enter this trade.
3. No. of Winning Trades vs. Losing Trades : We would like to see a significantly higher number of winning trades.
4. Avg. # of bars in a trade : This gives us an idea of how long on average we might have to wait to see the results of this strategy either in favor of our reward or against our desired direction. Some trades can be completed in around 15-20 bars on average and some trades have shown to take upto 45 days to reach desired reward. This is in line with our planned holding period, but gives the trader a sense of time and increased level of patience.
The future updates will have more utility of the various elements of the strategy tester and the entire exit strategy will be integrated into the script.
This script is not to be used as a standalone method and must be studied well in order to execute trades. I have not hidden visibility on other time-frames, but since order execution is done on the Daily time-frame, the script must run on the Daily time-frame only.
There are many other factors to be taken into consideration before entering a trade and proper risk management and position sizing rules must be followed.
Our bootcamp participants will use this strategy tester in conjunction with the invite-only Trading Toolkit assigned to them.
The development of this script will be ongoing and all comments and feedback are welcome.
Wyszukaj w skryptach "swing trading"
Swing Dream - PAINT BARS | MA | EMA | DMA | VWAP | TABLE | ADR %- Swing Dream -
Script created for breakout-swing traders, in the style of QullaMaggie * , Dan Zanger, Oliver Kell, and Stockbee.
The following indicators are used by most successful breakout-swing traders such as mentioned above.
(As published) it contains:
Painted Bars, also known as inside/outside candles. Used for candle analysis and to determine breakout pivots & levels. For instance; use it in different timeframes and seek formations (ex, 3-1-2). For further inspiration, study Rob Smith's The Strat .
MA, Simple Moving Averages (Basic levels = 10,20,50,200). Use this indicator to define resistance/support areas as well as the overall long/swing-term trend. In breakout strategies such as EP, Flags, etc this can be used for trailing stops; an example, post-breakout, let the price ride the 20ma before exiting your position.
EMA, Exponential Moving Averages with periods inspired by Qullamaggie (10,20,65). Use this on shorter timeframes (ex, 1h) and for the same principles as MAs.
VWAP, Volume-Weighted Average Price. As for the previous, utilize this as a level indicator to find areas of resistance/support. Good for swing-trading as it implies whenever holders are profitable or not.
DMA, Displaced Moving Average (Horizontal). Personally, I use this a lot. Works very well for trailing stops (post breakout) and "bounce" areas. Choose your own offset and period.
ADR%, Average Daily Range Percentage. Displayed in the table and used to define a symbol's volatility. A very good tool for Qullamaggie-style trading. Personally, I try to find setups with over 6% ADR. Basic definition; low ADR% = Increased chance of a symbol to move slower and in smaller ranges. A higher value equals the opposite.
Table. A table with basic symbol-related information. Could save you plenty of time whenever you scan or search for new swing setups. Looking to add more features here.
Why should you use this script? Well, instead of having tens of different indicators, use this script and combine everything together with EP, Flag, or breakout principles. Suited for every plan, and more efficient in my opinion.
View settings to turn on/off different indicators.
* If you're looking for an introduction and further explanation of how Qullamaggie uses mentioned indicators, I could recommend checking out his website, stream, or participation in "Chat With Traders".
At last, I want to credit: @jkcqld @neolao @TheScrutiniser
This Script will get updated and improved.
// TechFille006
Baekdoo compressed multi EMA box and its crossover indicatorHi forks,
I'm trader Baekdoosan who trading Equity from South Korea. This Baekdoo compressed multi EMA box and its crossover indicator tells us good trading time for swing trading.
Here is the idea. As you can see formula, I put ema of 5 days to 100 days.
and draw box when all disparity of the EMAs are less than 5%
I put those value in input variable as 105 (100 means same as max/min disparity ratio, 105 means max is 5% greater than min). This can be used 110 (10% of box) based on your needs.
Once box are drew, I put indicator when it crossover the box with 5 times larger than 60 days' highest volume. Then I put triangle indicator. This will be good trading point for short-mid term trading. you can check historical chart to evaluate this.
Hope this will help your trading on equity as well as crypto. I didn't try it on futures . Best of luck all of you. Gazua~!
CPR, Camarilla & Moving AverageThis script is created primarily for Intraday trading but can also be used for short and long term trading. This is a combination of Central Pivot Range (CPR), Moving Averages and Camarilla Pivot levels (with inner levels). This helps you to combine the strategies of CPR and Moving Averages to identify the best trading opportunities with greater edge. Central Pivot Range and Camarilla pivots are taken from PivotBoss by Franc Ochoa.
Key features:
# Daily CPR levels
# Weekly CPR levels
# Monthly CPR levels
# Previous Day High and Lows
# Previous Week Highs and Lows
# Previous Month Highs and Lows
# Camarilla Pivots with inner Levels
# CPR Levels for the next Day, Week and Month
# 5 Simple moving averages and 5 Exponential Moving Averages
What separates this script from other scripts with CPR and Moving averages?
# One of the few indicators (if not the only one) which combines the 2 types of Moving Averages, CPR and also Camarilla Pivots.
# CPR Levels for not just the next Day, but for next Week(Weekly CPR) and Month(Monthly CPR) also.
# Hide the previous day's levels according to your wish. This is the most unique feature of this indicator. You can set the number of Daily CPR levels you want to load in the chart. This is not just for the Daily CPR but also for the Weekly and Monthly CPR also. This makes the chart less cluttered and prevents the candles from getting buried in the indicators. Please notice how the previous day's CPR levels are hidden in the displayed demo chart on the script page. In the chart, only one trading day's data is shown(by default).
# This script is OPEN SOURCE.
Strategies :
For CPR & Camarilla Strategies for intraday trading and swing trading refer to the book 'Secrets of a Pivot Boss: Revealing Proven Methods for Profiting in the Market' by Franklin O. Ochoa.
Moving averages strategies :
Moving averages can be combined and also used individually for several strategies
* 9 EMA can be used as trailing stop loss for strong moving trends that helps you to catch big moves.
* 20sma can be used not just trailing stop loss but also for taking re-entry to the trend.
* Golden cross - The golden cross occurs when a short-term moving average crosses over a major long-term moving average to the upside. This indicates a bullish turn in the market. Eg: 50 SMA cuts 200 SMA from below.
* Death Cross - The death cross occurs when the short term moving average crosses the long-term average from above. This indicates a bearish turn in the market. Eg: 50 SMA cuts 200 SMA from above.
* When 20 SMA is above 50 SMA and 20 SMA and 50 SMA are angling up like parallel lines, then it denotes bullish strength. If this happens right after Golden Cross, big moves to the upside can be expected.
* When 20 SMA is below 50 SMA and 20 SMA and 50 SMA are angling down like parallel lines, then it denotes bearish strength. If this happens right after Death Cross, big moves to the downside can be expected.
* When 20SMA and 50 SMA are going flat and crossing each other, then it denotes sideways sentiment.
Moving average strategies are taken from the book 'How to Make Money in Intraday Trading' by Ashwani Gujral. For learning more about how to combine CPR and Moving averages in your trading please refer to this book.
Angle of Bollinger Bands AlertThis script is used to calculate angle of Bollinger Bands and also setup alerts.
The angle is based on the rules:
- if the previous 2 is 1.1, previous 1 is 1, and the current is 1.1, then the angle should be 90 degrees.
- if the previous 2 is 0.9, previous 1 is 1, and the current is 0.9, then the angle should be 270 degrees
If upper angle is below 90 degrees and close is above the average, it is long signal.
If lower angle is above 270 degrees and close is below the average, it is short signal.
- It is good for catch trend trading.
- Not good for swing trading as the BB changes are very tiny but angles for upper may hit below 90 degrees or angle of lower may be above 270 degrees.
Fat Side PathI got the idea for a narrow Donchian Channel with a short lookback period which closely follows the price fluctuation in which the sides of the channel have a thickness according to the range of the last touching candle.
Any channel, be it Donchian, Keltner, Bollinger Bands or Parallel, has an upside and a downside, touching the upside is a buy signal as this may initiate an uptrend, the downside a sell signal because a down trend may come.
This gave me the idea to make only the last touched side fat, thus creating visible switching between uptrend and downtrend. However this is ‘too digital’, as in practice also periods of no trend occur in which signaling a trend would give a false signal. In a Donchian channel (and also Bollinger Bands) such periods are marked by narrowing the channel. So I gave a no trend signal to the sides when the channel is narrower than a minimum width to call a trend. I gave the thing nice colours and proper default settings.
Use of the channel in trading.
I think this thing can be useful for swing trading. In channels two typical things may happen that should be noted by the trader, these are LB, Leaving the Border, which signals a trend reversal and FTT, Failure To Traverse, i.e. the price doesn’t manage to cross the channel to the other side. This affirms the trend. FTT’s are not expected in short lookback channels like this path (Sidenote: Fibonacci levels can be regarded as predictions where FTT’s may occur). The fat side indicates direction. Because somehow trends seem to end with a notable range extension, this channel sometimes produces a “Big Blob” where the trend reverses.
I intend to use this thing together with my Keltner Fibzones channel, where the zones serve as a ‘landscape’ in which the Fat Side Path meanders providing ‘comments’ on the short term price movements.
CCI Breakout TraderWorks well on Bitcoin or most altcoins on a 15min chart or higher.
What is this exactly?
This is an indicator that uses horizontal RSI + EMA lines with a CCI line on top of it to provide optimal entry and exit positions for trading. There is also a breakout indicator based on the width of Bollinger Bands.
How to use:
If the blue stream passes upwards on the red heading to the white - it's heading towards a good BUY signal. To be safe you wait until it passes above the white line, then BUY LONG. Another signal to buy long is when the blue stream passes above the white and green lines.
Selling is essentially the opposite, if the blue stream is passing down from the green or white lines, then it's time to sell and exit your trade.
If you need help knowing when to enter and exit a trade the indicator will draw a grey candle on your chart to signal it's time to exit a long trade and it will draw a purple candle when it's time to enter a long.
--
Breakout alert:
If you see a green vertical bar it's a warning that there is a potential breakout in price coming for whichever coin you are looking at. The price breakout could go either direction, so make sure you watch the blue stream.
--
Important tips:
The direction of the green/white/red lines are important - if they are heading down that means it might not be the best time to enter your trade, even if the blue stream crosses up on the red and/or white lines.
The colored horizontal lines are there to let you know if the blue stream is near the bottom of those lines (anywhere from hline 15 to 50) and heading upwards, you will more likely have a longer positive trade. If the blue stream is above 60 hline and it looks like a good trade (passing up on the red and white lines), expect to have a shorter trade.
I use this for swing trading various crypto currencies, once you learn how to read it, you can catch amazing uptrends really early and you can exit trades before some big drops happen.
Ripster EMA CloudsEMA Cloud By Ripster
EMA Cloud System is a Trading System Invented by Ripster where areas are shaded between two desired EMAs. The concept implies the EMA cloud area serves as support or resistance for Intraday & Swing Trading. This can be utilized effectively on 10 Min for day trading and 1Hr/Daily for Swings. Ripster himself utilizes various combinations of the 5-12, 34-50, 8-9, 20-21 EMA clouds but the possibilities are endless to find what works best for you.
“Ideally, 5-12 or 5-13 EMA cloud acts as a fluid trendline for day trades. 8-9 EMA Clouds can be used as pullback Levels –(optional). Additionally, a high level price over or under 34-50 EMA clouds confirms either bullish or bearish bias on the price action for any timeframe” – Ripster
Medium Term Weighted Stochastic (STPMT) by DGTLa Stochastique Pondérée Moyen Terme (STPMT) , or Mᴇᴅɪᴜᴍ Tᴇʀᴍ Wᴇɪɢʜᴛᴇᴅ Sᴛᴏᴄʜᴀꜱᴛɪᴄꜱ created by Eric Lefort in 1999, a French trader and author of trading books
█ The STPMT indicator is a tool which concerns itself with both the direction and the timing of the market. The STPMT indicator helps the trader with:
The general trend by observing the level around which the indicator oscillates
The changes of direction in the market
The timing to open or close a position by observing the oscillations and by observing the relative position of the STPMT versus its moving average
STPMT Calculation
stpmt = (4,1 * stoch(5, 3) + 2,5 * stoch(14, 3) + stoch(45, 14) + 4 * stoch(75, 20)) / 11.6
Where the first argument of the stoch function representation above is period (length) of K and second argument smoothing period of K. The result series is then plotted as red line and its moving average as blue line. By default disabled gray lines are the components of the STPMT
The oscillations of the STPMT around its moving average define the timing to open a position as crossing of STMP line and moving average line in case when both trends have same direction. The moving average determines the direction.
Long examples
█ Tʜᴇ CYCLE Iɴᴅɪᴄᴀᴛᴏʀ is derived from the STPMT. It is
cycle = stpmt – stpmt moving average
It is indicates more clearly all buy and sell opportunities. On the other hand it does not give any information on market direction. The Cycle indicator is a great help in timing as it allows the trader to more easily see the median length of an oscillation around the average point. In this way the traders can simply use the time axis to identify both a favorable price and a favorable moment. The Cycle Indicator is presented as histogram
The Lefort indicators are not a trading strategy. They are tools for different purposes which can be combined and which can serve for trading all instruments (stocks, market indices, forex, commodities…) in a variety of time frames. Hence they can be used for both day trading and swing trading.
👉 For whom that would like simple version of the Cycle indicator on top of the main price chart with signals as presented below.
Please note that in the following code STMP moving average direction is not considered and will plot signals regardless of the direction of STMP moving average. It is not a non-repainting version too.
here is pine code for the overlay version
// © dgtrd
//@version=4
study("Medium Term Weighted Stochastic (STPMT) by DGT", "STPMT ʙʏ DGT ☼☾", true, format.price, 2, resolution="")
i_maLen = input(9 , "Stoch MA Length", minval=1)
i_periodK1 = input(5 , "K1" , minval=1)
i_smoothK1 = input(3 , "Smooth K1", minval=1)
i_weightK1 = input(4.1 , "Weight K1", minval=1, step=.1)
i_periodK2 = input(14 , "K2" , minval=1)
i_smoothK2 = input(3 , "Smooth K2", minval=1)
i_weightK2 = input(2.5 , "Weight K2", minval=1, step=.1)
i_periodK3 = input(45 , "K3" , minval=1)
i_smoothK3 = input(14 , "Smooth K3", minval=1)
i_weightK3 = input(1. , "Weight K3", minval=1, step=.1)
i_periodK4 = input(75 , "K4" , minval=1)
i_smoothK4 = input(20 , "Smooth K4", minval=1)
i_weightK4 = input(4. , "Weight K4", minval=1, step=.1)
i_data = input(false, "Components of the STPMT")
//------------------------------------------------------------------------------
// stochastic function
f_stoch(_periodK, _smoothK) => sma(stoch(close, high, low, _periodK), _smoothK)
//------------------------------------------------------------------------------
// calculations
// La Stochastique Pondérée Moyen Terme (STPMT) or Medium Term Weighted Stochastics calculation
stpmt = (i_weightK1 * f_stoch(i_periodK1, i_smoothK1) + i_weightK2 * f_stoch(i_periodK2, i_smoothK2) + i_weightK3 * f_stoch(i_periodK3, i_smoothK3) + i_weightK4 * f_stoch(i_periodK4, i_smoothK4)) / (i_weightK1 + i_weightK2 + i_weightK3 + i_weightK4)
stpmt_ma = sma(stpmt, i_maLen) // STPMT Moving Average
cycle = stpmt - stpmt_ma // Cycle Indicator
//------------------------------------------------------------------------------
// plotting
plotarrow(change(sign(cycle)), "STPMT Signals", color.green, color.red, 0, maxheight=41)
alertcondition(cross(cycle, 0), title="Trading Opportunity", message="STPMT Cycle : Probable Trade Opportunity\n{{exchange}}:{{ticker}}->\nPrice = {{close}},\nTime = {{time}}")
[blackcat] L2 Ehlers Fisherized Deviation Scaled OscillatorLevel: 2
Background
John F. Ehlers introuced Fisherized Deviation Scaled Oscillator in Oct, 2018.
Function
In “Probability—Probably A Good Thing To Know,” John Ehlers introduces a procedure for measuring an indicator’s probability distribution to determine if it can be used as part of a reversion-to-the-mean trading strategy. Dr. Ehlers demonstrates this method with several of his existing indicators and presents a new indicator that he calls a deviation-scaled oscillator with Fisher transform. It charts the probability density of an oscillator to evaluate its applicability to swing trading.
Key Signal
FisherFilt --> Ehlers Fisherized Deviation Scaled Oscillator fast line
Trigger --> Ehlers Fisherized Deviation Scaled Oscillator slow line
Pros and Cons
100% John F. Ehlers definition translation, even variable names are the same. This help readers who would like to use pine to read his book.
Remarks
The 91th script for Blackcat1402 John F. Ehlers Week publication.
Readme
In real life, I am a prolific inventor. I have successfully applied for more than 60 international and regional patents in the past 12 years. But in the past two years or so, I have tried to transfer my creativity to the development of trading strategies. Tradingview is the ideal platform for me. I am selecting and contributing some of the hundreds of scripts to publish in Tradingview community. Welcome everyone to interact with me to discuss these interesting pine scripts.
The scripts posted are categorized into 5 levels according to my efforts or manhours put into these works.
Level 1 : interesting script snippets or distinctive improvement from classic indicators or strategy. Level 1 scripts can usually appear in more complex indicators as a function module or element.
Level 2 : composite indicator/strategy. By selecting or combining several independent or dependent functions or sub indicators in proper way, the composite script exhibits a resonance phenomenon which can filter out noise or fake trading signal to enhance trading confidence level.
Level 3 : comprehensive indicator/strategy. They are simple trading systems based on my strategies. They are commonly containing several or all of entry signal, close signal, stop loss, take profit, re-entry, risk management, and position sizing techniques. Even some interesting fundamental and mass psychological aspects are incorporated.
Level 4 : script snippets or functions that do not disclose source code. Interesting element that can reveal market laws and work as raw material for indicators and strategies. If you find Level 1~2 scripts are helpful, Level 4 is a private version that took me far more efforts to develop.
Level 5 : indicator/strategy that do not disclose source code. private version of Level 3 script with my accumulated script processing skills or a large number of custom functions. I had a private function library built in past two years. Level 5 scripts use many of them to achieve private trading strategy.
Parabolic SAR Swing strategy GBP JPY Daily timeframeToday I bring you a new strategy thats made of parabolic sar. It has optmized values for GBPJPY Daily timeframe chart.
It also has a time period selection, in order to see how it behave between selected years.
The strategy behind it is simple :
We have an uptrend , (the psar is below our candles) we go long. We exit when our candle crosses the psar value.
The same applies for downtrend(the psar is above our candles), where we go short. We exit when our candle cross the psar value.
Among the basic indicators, it looks like PSAR is one of the best canditates for swing trading.
If you have any questions, please let me know.
Ultimate VWAP Bands- Ultimate VWAP Bands is a script that helps to decide and further clarify areas of oversold and overbought conditions.
- For example, when the price is in the lowest band it is extremely oversold relative to the VWAP . Hence it should be considered a good place to buy with a high risk to reward payoff.
- Each band is set at a fixed offset away from the VWAP . The "VWAP Band Multiplier" adjusts this and is a key part of the script. This allows the indicator to be adjusted based on the assets volatility . For example, with Crypto. A multiplier of 1 would be strongly advised. Whilst a multiplier of 0.1-0.25 would be useful for currency pairs.
- This indicator can be used for all manners of trading. However, it is most effective when used for scalping and swing trading.
[blackcat] L2 Swing Oscillator Swing MeterLevel: 2
Background
Swing trading is a type of trading aimed at making short to medium term profits from a trading pair over a period of a few days to several weeks. Swing traders mainly use technical analysis to look for trading opportunities. In addition to analyzing price trends and patterns, these traders can also use fundamental analysis.
Function
L2 Swing Oscillator Swing Meter is an oscillator based on breakouts. Another important feature of it is the swing meter, which confirms the top or bottom's confidence level with different color candles. The higher of the candles stack up, the higher confidence level is indicated.
Key Signal
absolutebot ---> absolute bottom with very high confidence level
ltbot ---> long term bottom with high confidence level
mtbot ---> middle term bottom with moderate confidence level
stbot ---> short term bottom with low confidence level
absolutetop ---> absolute top with very high confidence level
lttop ---> long term top with high confidence level
mttop ---> middle term top with moderate confidence level
sttop ---> short term top with low confidence level
fastline ---> oscillator fast line
slowline ---> oscillator slow line
Pros and Cons
Pros:
1. reconfigurable swing oscillator based on breakouts
2. swing meter can confirm/validate the bottom and top signal
Cons:
1. not appliable with trading pairs without volume information
2. small time frame may not trigger swing meter function
Remarks
This is a simple but very comprehensive technical indicator
Readme
In real life, I am a prolific inventor. I have successfully applied for more than 60 international and regional patents in the past 12 years. But in the past two years or so, I have tried to transfer my creativity to the development of trading strategies. Tradingview is the ideal platform for me. I am selecting and contributing some of the hundreds of scripts to publish in Tradingview community. Welcome everyone to interact with me to discuss these interesting pine scripts.
The scripts posted are categorized into 5 levels according to my efforts or manhours put into these works.
Level 1 : interesting script snippets or distinctive improvement from classic indicators or strategy. Level 1 scripts can usually appear in more complex indicators as a function module or element.
Level 2 : composite indicator/strategy. By selecting or combining several independent or dependent functions or sub indicators in proper way, the composite script exhibits a resonance phenomenon which can filter out noise or fake trading signal to enhance trading confidence level.
Level 3 : comprehensive indicator/strategy. They are simple trading systems based on my strategies. They are commonly containing several or all of entry signal, close signal, stop loss, take profit, re-entry, risk management, and position sizing techniques. Even some interesting fundamental and mass psychological aspects are incorporated.
Level 4 : script snippets or functions that do not disclose source code. Interesting element that can reveal market laws and work as raw material for indicators and strategies. If you find Level 1~2 scripts are helpful, Level 4 is a private version that took me far more efforts to develop.
Level 5 : indicator/strategy that do not disclose source code. private version of Level 3 script with my accumulated script processing skills or a large number of custom functions. I had a private function library built in past two years. Level 5 scripts use many of them to achieve private trading strategy.
L1 Mid-Term Swing Oscillator v1Level: 1
Background
Oscillators are widely used set of technical analysis indicators. They are popular primarily for their ability to alert of a possible trend change before that change manifests itself in price and volume . They should work best in times of sideways markets.
Function
L1 Short-Mid-Long-Term Swing Oscillator puts three terms of oscillators to cover short-term, middle-term and long-term oscillators at the same time. By resonating all these three oscillators, short-term scalping signal and middle term swing signal are disclosed. You can see both short and mid term signal under one indicator which give you more confidence to follow the trend.
Key Signal
I didn't handle the key signals well. I piled up all the useful signals I found, and it is really difficult to classify them one by one. I feel tired when I think about this problem. Therefore, the code of the overall signal is rather confusing, sorry.
Pros and Cons
Pros:
1. Three oscillators are used to cover short, mid, long term oscillations.
2. Short-Mid term resonance can be observed to have higher confidence level.
3. Use single indicator for scalping and swing trading is possible.
Cons:
1. No deep dive into very accurate long and short entries.
2. A trade off between sensitivity and stability may be needed by traders' subjective judge.
Remarks
I enjoyed the fun of put three different oscillator together to cover short, mid, long terms. But how to use them perfectly is really more brainstorming.
Readme
In real life, I am a prolific inventor. I have successfully applied for more than 60 international and regional patents in the past 12 years. But in the past two years or so, I have tried to transfer my creativity to the development of trading strategies. Tradingview is the ideal platform for me. I am selecting and contributing some of the hundreds of scripts to publish in Tradingview community. Welcome everyone to interact with me to discuss these interesting pine scripts.
The scripts posted are categorized into 5 levels according to my efforts or manhours put into these works.
Level 1 : interesting script snippets or distinctive improvement from classic indicators or strategy. Level 1 scripts can usually appear in more complex indicators as a function module or element.
Level 2 : composite indicator/strategy. By selecting or combining several independent or dependent functions or sub indicators in proper way, the composite script exhibits a resonance phenomenon which can filter out noise or fake trading signal to enhance trading confidence level.
Level 3 : comprehensive indicator/strategy. They are simple trading systems based on my strategies. They are commonly containing several or all of entry signal, close signal, stop loss, take profit, re-entry, risk management, and position sizing techniques. Even some interesting fundamental and mass psychological aspects are incorporated.
Level 4 : script snippets or functions that do not disclose source code. Interesting element that can reveal market laws and work as raw material for indicators and strategies. If you find Level 1~2 scripts are helpful, Level 4 is a private version that took me far more efforts to develop.
Level 5 : indicator/strategy that do not disclose source code. private version of Level 3 script with my accumulated script processing skills or a large number of custom functions. I had a private function library built in past two years. Level 5 scripts use many of them to achieve private trading strategy.
Why is it ok to backtest on TradingView from now on!TradingView backtester has bad reputation. For a good reason - it was producing wrong results, and it was clear at first sight how bad they were.
But this has changed. Along with many other improvements in its PineScript coding capabilities, TradingView fixed important bug, which was the main reason for miscalculations. TradingView didn't really speak out about this fix, so let me try :)
Have a look at this short code of a swing trading strategy (PLEASE DON'T FOCUS ON BACKTEST RESULTS ATTACHED HERE - THEY DO NOT MATTER). Sometimes entry condition happens together with closing condition for the already ongoing trade. Example: the condition to close Long entry is the same as a condition to enter Short. And when these two aligned, not only a Long was closed and Short was entered (as intended), but also a second Short was entered, too!!! What's even worse, that second short was not controlled with closing conditions inside strategy.exit() function and it very often lead to losses exceeding whatever was declared in "loss=" parameter. This could not have worked well...
But HOORAY!!! - it has been fixed and won't happen anymore. So together with other improvements - TradingView's backtester and PineScript is now ok to work with on standard candlesticks :)
Yep, no need to code strategies and backtest them on other platforms anymore.
----------------
Having said the above, there are still some pitfalls remaining, which you need to be aware of and avoid:
Don't backtest on HeikenAshi, Renko, Kagi candlesticks. They were not invented with backtesting in mind. There are still using wrong price levels for entries and therefore producing always too good backtesting results. Only standard candlesticks are reliable to backtest on.
Don't use Trailing Stop in your code. TradingView operates only on closed candlesticks, not on tick data and because of that, backtester will always assume price has first reached its favourable extreme (so 'high' when you are in Long trade and 'low' when you are in Short trade) before it starts to pull back. Which is rarely the truth in reality. Therefore strategies using Trailing Stop are also producing too good backtesting results. It is especially well visible on higher timeframe strategies - for some reason your strategy manages to make gains on those huge, fat candlesticks :) But that's not reality.
"when=" inside strategy.exit() does not work as you would intuitively expect. If you want to have logical condition to close your trade (for example - crossover(rsi(close,14),20)) you need to place it inside strategy.close() function. And leave StopLoss + TakeProfit conditions inside strategy.exit() function. Just as in attached code.
If you're working with pyramiding, add "process_orders_on_close=ANY" to your strategy() script header. Default setting ("=FIFO") will first close the trade, which was opened first, not the one which was hit by Stop-Loss condidtion.
----------------
That's it, I guess :) If you are noticing other issues with backtester and would like to share, let everyone know in comments. If the issue is indeed a bug, there is a chance TradingView dev team will hear your voice and take it into account when working on other improvements. Just like they heard about the bug I described above.
P.S. I know for a fact that more improvements in the backtesting area are coming. Some will change the game even for non-coding traders. If you want to be notified quickly and with my comment - gimme "follow".
Complete Trend Trading System [Fhenry0331]This system was designed for the beginner trader to make money swing trading. Your losses will be small and your gains will be mostly large. You will show consistent profit. Period.
The system works on any security you like to trade. I used GBPUSD as an example because of the up swing and down swing it had recently. I tried to put as much information of how the system works in the chart. Hope it helps and is not to cluttered.
I will reiterate how the system works here: Everything is based off of closed price.
Legend
Uptrend: Buy
Green bar: initial start of an uptrend or uptrend continuing. Place order above that bar. If the initial bar does not stray too far from the MVWAP , I will place orders above subsequent bars if no filled occurred.
If initial start of the trend is missed, I will wait for the pullback. A pullback is a close below the MVWAP, and a close above the EMA (Low), RSI is above 50. Orders are placed above the pullback bars with plotted char "B" and also plotted green triangle up. Again orders are placed above those bars. the bars do not notate automatic buys. Don't chase anything. You will miss the initial bar on something because of news or earnings and it rocket up. Just wait, it will pullback. If it doesn't, to hell with it, on to the next.
Take profits: In the indicator you will see "T." That notates to take some profits. It is a suggestion. I was always told to take profits into spikes, as well as you can never lose money if you take profits. Up to you if you want to scale out and take the suggested profits or not.
Exit Completely: In an uptrend, close your entire position on bars colored yellow or red. (Again, closed bars)
In uptrend bars colored orange and black, do nothing, they are just pullback bars. Look for the buy pullback signal, then follow pullback buy rules for an uptrend.
Downtrend: Short
Red bar: initial start of a downtrend or downtrend continuing. Place order below the bar. If the initial bar does not stray too far fro the MVWAP, place orders below subsequent bars.
If initial start on the downtrend is missed, wait for the pullback. A pullback is a close above the MVWAP, and close below the EMA(Low). RSI is below 50. Orders are placed below the pullback bars with the plotted char "S" and also plotted red triangle. Again those bars are not automatic shorts, orders are placed below them. Don't chase anything. Wait for price to come into your plan. The idea FOMO is the stupidest thing ever, how can you miss out on something when it is always there. The market is always there and something will come into your zone. Chill.
"T": same as in uptrend, suggestion to take some profits.
Exit Completely: In a downtrend, close your entire position on bars colored orange or green.
In downtrend you will see bars colored yellow and black, do nothing, they are pullback bars. Look for the pullback short signal and follow pullback short rules.
If you have any questions get at me. Take a look at it on what you trade. Flip it through different securities.
Best of luck in all you do.
P.S. You should not take a trade right before earnings. You should also exit a trade right before earnings.
Binque's Multi-Moving Average Binque's Multi-Moving Average - One indicator with four simple moving average and four exponential moving averages, plus as a bonus a Day High moving average and a Day Low Moving Average.
Simple Moving Average or MA(14), MA(50), MA(100) and MA(200) all in one indicator
Exponential Moving Average or EMA(8), EMA(14), EMA(20) and EMA(33) all in one indicator
Day High Moving Average - Tracks the Daily High versus most moving averages track the daily close.
Day Low Moving Average - Tracks the Daily Low versus most moving average track the daily close.
To Disable moving averages, Set the color to the chart background and then set the length to 1 and uncheck.
I Use the Daily High Moving Average to track upward resistance in a stock movement for Swing Trading.
I Use the Daily Low Moving Average to track my trailing stop in a stock movement for Swing Trading.
Big Snapper Alerts R2.0 by JustUncleLThis is a diversified Binary Option or Scalping Alert indicator originally designed for lower Time Frame Trend or Swing trading. Although you will find it a useful tool for higher time frames as well.
The Alerts are generated by the changing direction of the ColouredMA (HullMA by default), you then have the choice of selecting the Directional filtering on these signals or a Bollinger swing reversal filter.
The filters include:
Type 1 - The three MAs (EMAs 21,55,89 by default) in various combinations or by themselves. When only one directional MA selected then direction filter is given by ColouredMA above(up)/below(down) selected MA. If more than one MA selected the direction is given by MAs being in correct order for trend direction.
Type 2 - The SuperTrend direction is used to filter ColouredMA signals.
Type 3 - Bollinger Band Outside In is used to filter ColouredMA for swing reversals.
Type 4 - No directional filtering, all signals from the ColouredMA are shown.
Notes:
Each Type can be combined with another type to form more complex filtration.
Alerts can also be disabled completely if you just want one indicator with one colouredMA and/or 3xMAs and/or Bollinger Bands and/or SuperTrend painted on the chart.
Warning:
Be aware that combining Bollinger OutsideIn swing filter and a directional filter can be counter productive as they are opposites. So careful consideration is needed when combining Bollinger OutsideIn with any of the directional filters.
Hints:
For Binary Options try ColouredMA = HullMA(13) or HullMA(8) with Type 2 or 3 Filter.
When using Trend filters SuperTrend and/or 3xMA Trend, you will find if price reverses and breaks back through the Big Fat Signal line, then this can be a good reversal trade.
Some explanation about the what Hull Moving average and ideas of how the generated in Big Snapper can be used:
tradingsim.com
forextradingstrategies4u.com
Inspiration from @vdubus
Big Snapper's Bollinger OutsideIn Swing filter in Action:
Colored Volume Bars [LazyBear]Edgar Kraut proposed this simple colored volume bars strategy for swing trading.
This is how the colors are determined:
- If today’s closing price and volume are greater than 'n' days ago, color today’s volume bar green.
- If today’s closing price is greater than 'n' days ago but volume is not, color today’s volume bar blue.
- Similarly, if today’s closing price and volume is less than 'n' days ago, color today’s volume bar orange.
- If today’s closing price is less than 'n' days ago but volume is not, color today’s volume bar red.
Buy the green or blue volume bars, use a 1% trailing stop, and stand aside on red or orange bars.
As you see, this is more for entry confirmation. I have not tested this on any instrument.
You may have to tune the lookback period for your instrument. Default is 10.
More info:
"A color-based system for short-term trading" - www.traders.com
List of all my indicators:
Multi-Factor ConsensusMFC (Market Field Coherence)
A Triumph of Complexity: The Fusion of Three Professional Engines to Visualize the Unified
Mind of the Market
█ OVERVIEW: BEYOND THE INDICATOR
This is not another lagging indicator. This is a command suite.
MFC (Market Field Coherence) is not a single tool, but a seamless integration of three professional-grade, independent analytical engines fused into a singular, awe-inspiring system. It's a masterwork of signal processing and applied mathematics designed to visualize the invisible—the collective, underlying state of the market.
It moves beyond the simplistic analysis of individual price bars to measure something far more profound: the degree of emergent coherence across an entire ensemble of market oscillators. While traditional tools see the market as a series of disconnected data points, MFC sees it as a dynamic, fluctuating field of forces. By deploying its three specialized engines, MFC identifies moments of critical transition when disparate, chaotic market inputs converge into a single, unified, and tradable state of being. It measures the very instant the "noise" becomes a "symphony," and generates signals only when all three engines are in unanimous agreement.
█ A TRINITY OF SYSTEMS: THREE INDICATORS IN ONE
MFC's unparalleled precision comes from its unique tripartite architecture. It is not a monolithic tool. It is a fusion of three distinct, professional-grade analytical engines, each performing a critical and independent function. Their synergy is what produces the high-quality, filtered signals and the profound analytical clarity.
ENGINE 1: The Quantum Coherence Engine
The heart of the system. This is a pure regime-detection indicator. Its sole purpose is to perform the heavy lifting of converting the oscillator ensemble into complex-plane phasors and calculating the two most critical metrics: the Coherence Index (CI) and the Dominant Phase . It constantly works to answer the primary question: " How unified is the market, and in which direction is it leaning? "
ENGINE 2: The Multi-Layer Confirmation Matrix
A high CI from the first engine is not enough. This second, independent engine acts as the ultimate quality filter. It is, in essence, a sophisticated confirmation indicator that runs two rigorous, non-negotiable checks: the Phase-Lock Detector (is the alignment tight enough?) and the Pairwise Entanglement Web (is the alignment broad-based and not a fluke?). This is a purely logical system designed to reject ambiguity, eliminate false positives, and validate the findings of the Coherence Engine. It answers the crucial follow-up question: " Is this detected coherence real, or is it a statistical ghost? "
ENGINE 3: The Advanced Visualization Suite
Raw data is meaningless without interpretation. This third engine is a full-fledged visual indicator in its own right, dedicated to translating the abstract mathematics from the other two engines into an intuitive, multi-dimensional language. Featuring the revolutionary Circular Orbit Plot , the atmospheric Quantum Field Cloud , and deep-dive analytical grids, it allows you to see the market's state in a way that numbers alone never could. It answers the final question: " What does this confirmed state of coherence actually look like? "
An Ignition Signal only fires when all three of these independent systems reach a unanimous conclusion. This is the source of MFC's power and precision.
█ THE PHILOSOPHY & THEORETICAL FOUNDATION
MFC is built upon a synthesis of advanced mathematical frameworks, each chosen for its unique ability to extract a deeper layer of truth from market data. Their combination across the three engines creates a system far greater than the sum of its parts.
1. The Kernel: Gaussian-Weighted Smoothing for Intelligent Lag Reduction
Simple and Exponential Moving Averages are primitive tools. MFC's engines reject them. We employ a Gaussian Kernel for all internal smoothing. This "bell curve" weighting assigns the most significance to the most recent data, gracefully decaying influence for older data. The result is a beautifully smooth yet highly responsive measure of coherence, fundamentally reducing the lag that plagues other systems.
The formula for the weight w at a distance i from the center μ is:
w(i) = exp(- (i - μ)² / (2 * σ²))
2. The Lens: Sigmoid Normalization for Non-Linear State Definition
To compare an RSI of 80 to a MACD of 0.5, MFC utilizes the robust and mathematically elegant Sigmoid (Logistic) Function. Its non-linear, "S-shaped" curve squashes any input into a perfect, bounded range, creating extreme sensitivity near the neutral midpoint and gracefully compressing values at the extremes. This provides a crystal-clear distinction between "weak," "strong," and "extreme" conditions.
f(x) = 1 / (1 + exp(-k * x))
3. The Engine: Complex-Plane Phasors for Coherence Measurement
This is the heart of Engine 1. Each normalized oscillator is transformed from a single scalar value into a two-dimensional vector (a phasor) in the complex plane, capturing its magnitude (strength) and its phase angle (position and velocity).
Resultant Vector (R) = Σ e^(iφₙ) = Σ cos(φₙ) + i·Σ sin(φₙ)
The Coherence Index (CI) is the magnitude of this resultant vector, normalized by the number of oscillators N:
CI = |R| / N
This mathematical blending— Gaussian smoothing for clean data, Sigmoid normalization to define state, and Complex-Plane Analysis to measure collective coherence—is what allows MFC to generate insight that is simply impossible to achieve with conventional tools.
█ THE INPUTS MENU: YOUR COMMAND & CONTROL
Every parameter is exposed, allowing you to fine-tune MFC's three engines to any instrument, timeframe, or trading style. Here is an exhaustive guide:
Oscillator Settings (Engine 1)
Enable/Disable Toggles & Lengths: Construct the perfect ensemble for your market. Shorter lengths for scalping (e.g., 5m chart), longer lengths for swing trading (e.g., 4H chart). Disable any oscillator that consistently acts as an outlier to reduce noise.
Normalization Anchors: Define the "extreme" boundaries for the Sigmoid function. Widen these anchors (e.g., RSI 80/20) for highly volatile assets to better capture the larger price swings.
Coherence & Confirmation Settings (Engines 1 & 2)
CI Smoothing Window: Controls the Gaussian Kernel for the final Coherence Index. A short window (2-4) offers a fast reaction for scalpers. A longer window (5-10) creates a smoother CI line for swing traders.
Ignition Threshold: The CI level needed to activate a signal check. A lower threshold (0.70) generates more signals. A higher threshold (0.85) produces fewer, but extremely high-conviction signals.
Phase Lock Tolerance & Min Entangled Pairs: These are the core parameters for the Confirmation Engine (Engine 2). Use tighter tolerances (e.g., 25°) and a higher number of pairs (e.g., 5+) to demand an incredibly high standard for signal confirmation.
█ THE DASHBOARD: YOUR QUANTITATIVE READOUT
The dashboard provides a real-time, numerical dissection of the market field, summarizing the outputs of all three engines.
CI (Coherence Index): What it is: The master metric from Engine 1. How to interpret: < 40% (Chaos): The market is disjointed. 40-70% (Coherent): A regime is forming. > 70% (Ignition Zone): High consensus.
Dom Phase (Dominant Phase): What it is: The "average" direction from Engine 1. How to interpret: The arrow gives the immediate directional bias.
Field Strength: What it is: CI × Average Amplitude . How to interpret: Measures alignment with conviction. A high Field Strength is the signature of a powerful, aggressive trend.
Entangled Pairs & Phase Lock: What they are: The direct readouts from the Confirmation Engine (Engine 2). How to interpret: The 🔒 symbol and a high pair count are the final "green lights" before a signal can be generated.
State: What it is: A real-time classification of the market's condition based on the combined output of all engines. How to interpret:
🚀 IGNITION: All three engines are in unanimous, bullish/bearish agreement.
⚡ COHERENT: The trend is healthy and coherence is stable.
💥 COLLAPSE: The regime's integrity is compromised.
🌀 CHAOS: The market is unpredictable.
Collapse Risk: What it is: A 0-100% gauge measuring the rate of recent CI decay. How to interpret: A leading indicator for trend exhaustion. A value rising above 50% is a powerful signal to tighten stops.
█ THE VISUALS: THE ART OF ANALYSIS (ENGINE 3)
The Visualization Suite (Engine 3) translates the complex calculations into an intuitive visual language. Learning to read these displays is like learning to see the market in a new dimension.
The Circular Orbit Plot: The soul of MFC. A polar grid showing each oscillator as a labeled vector.
Angle = Phase, Length = Amplitude. Watch for Convergence: when scattered vectors cluster into a single quadrant, you are witnessing the birth of a new regime in real-time.
The Quantum Field Cloud: An atmospheric overlay on the price chart.
Color = Dominant Phase ( Green for bullish, Red for bearish). Opacity = Coherence Index . A dense, opaque cloud signifies an extremely strong, coherent regime.
The Entanglement Web Matrix & Phase-Time Heat Map: Deep-dive analytical tools. Use the Web to diagnose the quality and breadth of coherence. Use the Heat Map to identify historical patterns and pivotal moments of unified market phase.
█ THE DEVELOPMENT: A QUEST FOR TRUTH
MFC was not created to be just another tool. It was engineered to solve the fundamental ambiguity of technical analysis by creating a system of checks and balances between three specialized engines. I sought to replace subjective interpretation with objective, multi-stage mathematical measurement. The choice of Gaussian kernels, Sigmoid functions, and complex-plane analysis was a deliberate decision to embrace the multi-dimensional reality of market dynamics rather than simplifying it into a single, misleading number.
This is a tool for the discerning trader who understands that the market is not a random walk, but a complex, adaptive system. MFC provides a new set of senses to perceive the behavior of that system.
"The financial markets are generally unpredictable. So that one has to have different scenarios... The idea that you can actually predict what's going to happen contradicts my way of looking at the market."
— George Soros
MFC does not predict. It measures . Its three engines work in concert to provide a high-resolution image of the market's current state , allowing you to align yourself with moments of profound clarity and step aside during times of absolute chaos. Trade the coherence, not the forecast.
█ IMPORTANT WARNINGS & DISCLAIMER
This tool is designed for analytical and informational purposes. It identifies periods of high statistical confluence based on the behavior of technical oscillators. This is not a "signal" service and provides no financial advice.
RISK OF LOSS: All trading and investment activities involve substantial risk of loss. Do not trade with capital you cannot afford to lose.
NO GUARANTEE: This indicator does not guarantee profits or prevent losses. Past performance is not indicative of future results.
USE CONFIRMATION: "Ignition" markers denote a unanimous conclusion from all three internal engines, not explicit instructions to buy or sell. They should be used as one component within a comprehensive trading plan.
REGIME DEPENDENT: The effectiveness of this tool is dependent on market conditions. It performs best in markets with clear cyclical behavior.
Taking you to school. - Dskyz, Trade with probability. Trade with consensus. Trade with MFC.
High Probability Trend Continuation (1:5 RR)this strategy is based on a high-probability trend continuation pattern, one of the most frequently occurring setups in financial markets. It uses EMA trend alignment to identify strong bullish or bearish conditions and waits for a controlled pullback before entering a trade in the direction of the trend.
Risk management is fully automated using ATR-based stop losses, ensuring the strategy adapts to market volatility. Each trade is executed with a fixed 1:5 risk-to-reward ratio, allowing profitability even with a modest win rate.
The strategy is designed to work across multiple markets and timeframes, including forex, stocks, indices, and crypto, making it suitable for both intraday and swing trading.
ATR Stop LinesATR Stop Lines
Plots dynamic stop-loss levels on the price chart based on ATR (Average True Range). Optionally adjusts stop distance based on volatility regime.
━━━━━━━━━━━━━━━━━━━━━━━━━━━━━━
🎯 WHAT IT DOES
Green line — Long stop (Close − ATR × multiplier)
Red line — Short stop (Close + ATR × multiplier)
Lines move with price and volatility. When regime-adjust is enabled, stop distance widens in high volatility and tightens in low volatility.
━━━━━━━━━━━━━━━━━━━━━━━━━━━━━━
📐 REGIME-ADJUSTED MULTIPLIERS
When enabled, the multiplier auto-adjusts based on the ATR percentile:
LOW (< 25th pctl) — 1.0× ATR — Tight stops, small moves expected
NORMAL (25–50th pctl) — 1.5× ATR — Standard distance
HIGH (50–75th pctl) — 2.0× ATR — Wider to avoid noise
EXTREME (> 75th pctl) — 2.5× ATR — Widest, or skip the trade
Disable regime-adjust to use a fixed multiplier for all conditions.
━━━━━━━━━━━━━━━━━━━━━━━━━━━━━━
📈 HOW TO USE
Entry: Note stop line level when entering a trade. Set stop-loss at or beyond that level.
Trailing: Move stop to new line level as price advances in your favor.
Sizing: Wider stop = smaller position to maintain constant risk.
Example:
BTC Daily, ATR = \$2,000, Regime = HIGH (2.0×)
Entry: \$50,000 → Long stop: \$46,000 / Short stop: \$54,000
━━━━━━━━━━━━━━━━━━━━━━━━━━━━━━
📊 STATUS LABEL
VOL — Current regime (LOW / NORMAL / HIGH / EXTREME)
ATR — Raw ATR value in price units
Mult — Active multiplier
Stop Dist — Current stop distance in price units
━━━━━━━━━━━━━━━━━━━━━━━━━━━━━━
⚙️ SETTINGS
ATR Settings:
ATR Length (default: 14)
Percentile Lookback (default: 100)
Timeframe:
Use Fixed Timeframe — Lock to specific TF
Fixed Timeframe (default: D)
Stop Settings:
Regime-Adjusted Multiplier — Toggle auto-adjust on/off
Base ATR Multiplier — Used when regime-adjust is off
LOW/NORMAL/HIGH/EXTREME Multipliers — Customize per regime
Display:
Show Long Stop / Show Short Stop
Show Status Label
Long/Short Stop Colors
━━━━━━━━━━━━━━━━━━━━━━━━━━━━━━
🔔 ALERTS
Vol → EXTREME
Vol → LOW
━━━━━━━━━━━━━━━━━━━━━━━━━━━━━━
💡 COMPANION INDICATOR
Use with ATR Volatility Regime (separate pane) for full context:
Pane indicator → percentile visualization, zone backgrounds
This indicator → actionable stop levels on price chart
Both use identical ATR/percentile logic and stay in sync.
━━━━━━━━━━━━━━━━━━━━━━━━━━━━━━
📝 NOTES
Works on any timeframe
Stops are dynamic — recalculate each bar
Not a signal generator — use with your own entry logic
━━━━━━━━━━━━━━━━━━━━━━━━━━━━━━
🏷️ TAGS
ATR, stop-loss, volatility, risk-management, position-sizing, trailing-stop, swing-trading
ATR Volatility RegimeATR Volatility Regime
A volatility classification indicator that uses ATR (Average True Range) percentile ranking to identify LOW , NORMAL , HIGH , or EXTREME volatility conditions.
Displayed as a separate pane oscillator (0–100 scale) with colored zones.
━━━━━━━━━━━━━━━━━━━━━━━━━━━━━━
💡 WHY THIS INDICATOR?
Most volatility indicators show raw ATR — a number without context. Is ATR = 50 high or low? Depends on the asset and recent history.
This indicator answers: "Is current volatility high or low for THIS asset, right now?"
What it adds over standard ATR:
Percentile context — Compares current ATR to its own history
Regime classification — Actionable labels instead of raw numbers
Visual zones — Instant read without interpretation
Optional MTF — Lock to a fixed timeframe while viewing another
Auto-adapts — Works on any asset without manual threshold tuning
━━━━━━━━━━━━━━━━━━━━━━━━━━━━━━
📐 CORE CONCEPTS
ATR (Average True Range)
Measures volatility in price units — how much an asset typically moves per bar. Directionless (magnitude only, not direction).
Calculation:
True Range = the greatest of:
High − Low (current bar's range)
|High − Previous Close| (gap up captured)
|Low − Previous Close| (gap down captured)
ATR = Moving average of True Range over N bars (default: 14)
Percentile Rank (Pctl)
Answers: "What percentage of historical values is the current value greater than?"
Pctl = 0% → Lowest ATR in lookback period (extreme compression)
Pctl = 50% → Median ATR (typical volatility)
Pctl = 100% → Highest ATR in lookback period (extreme expansion)
━━━━━━━━━━━━━━━━━━━━━━━━━━━━━━
🎯 WHAT IT DOES
Classifies current volatility into four regimes:
LOW (< 25th percentile) — Compression, breakout likely brewing
NORMAL (25th–50th percentile) — Typical market conditions
HIGH (50th–75th percentile) — Elevated volatility, use caution
EXTREME (> 75th percentile) — Rare expansion, tighten stops or stay flat
━━━━━━━━━━━━━━━━━━━━━━━━━━━━━━
📊 DISPLAY COMPONENTS
Oscillator Line (0–100)
ATR percentile rank over time. Color matches regime:
Blue = LOW
Gray = NORMAL
Orange = HIGH
Red = EXTREME
Zone Backgrounds
Colored bands at threshold levels for instant visual reference.
Status Label
VOL — Current regime
ATR — Raw ATR value (for stop sizing)
Pctl — Percentile rank (0–100%)
TF — Active timeframe (chart or fixed)
━━━━━━━━━━━━━━━━━━━━━━━━━━━━━━
📈 HOW TO USE
LOW Volatility (Pctl < 25%):
Market compressed — "calm before the storm"
Watch for breakout setups
Pctl = 0% often precedes significant moves
NORMAL Volatility (Pctl 25–50%):
Typical conditions
Standard position sizing and stops
HIGH Volatility (Pctl 50–75%):
Elevated movement — reduce size
Widen stops to avoid noise
EXTREME Volatility (Pctl > 75%):
Rare, intense conditions
Avoid new entries or tighten risk
━━━━━━━━━━━━━━━━━━━━━━━━━━━━━━
⚙️ SETTINGS
ATR Settings:
ATR Length (default: 14) — Period for ATR calculation
Percentile Lookback (default: 100) — Bars for percentile ranking
Timeframe:
Use Fixed Timeframe (default: off) — Lock calculation to specific TF
Fixed Timeframe (default: D) — TF to use when fixed mode enabled
Thresholds:
Low Threshold (default: 25)
High Threshold (default: 50)
Extreme Threshold (default: 75)
Display:
Show Zone Background — Toggle colored fills
Show Status Label — Toggle info label
━━━━━━━━━━━━━━━━━━━━━━━━━━━━━━
📋 SUGGESTED LOOKBACK BY ASSET
Crypto — 100 bars (fast regime shifts)
Stocks — 252 bars (one trading year)
Forex — 100–150 bars
Commodities — 150–200 bars (seasonal patterns)
━━━━━━━━━━━━━━━━━━━━━━━━━━━━━━
🔔 ALERTS
Vol → EXTREME
Vol → HIGH
Vol → LOW
Vol exits HIGH
━━━━━━━━━━━━━━━━━━━━━━━━━━━━━━
💡 PRACTICAL APPLICATIONS
Stop-Loss Sizing:
Use raw ATR for stops. Example: Stop = Entry − (1.5 × ATR)
Position Sizing:
Reduce size when percentile is HIGH or EXTREME.
Entry Filtering:
LOW regime = prepare for breakout
EXTREME regime = avoid new entries
━━━━━━━━━━━━━━━━━━━━━━━━━━━━━━
📝 NOTES
Works on any timeframe — adapts to chart or locks to fixed TF
ATR is non-directional — magnitude only
Percentile auto-adapts to each asset's volatility profile
Not a standalone signal — combine with trend/regime filters
━━━━━━━━━━━━━━━━━━━━━━━━━━━━━━
🏷️ TAGS
volatility, ATR, average-true-range, percentile, regime, risk-management, position-sizing, swing-trading, MTF


